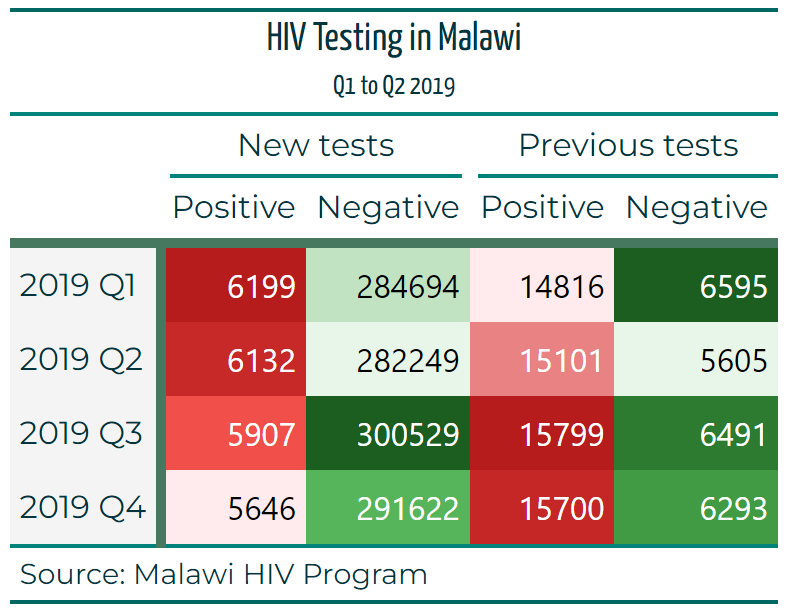
The Great Tables package is ideal for crafting beautiful, high-quality tables for reports, publications, and data presentations. Effective tables typically share three key characteristics:
structuring that aids in the reading of the table.
well-formatted values, fitting expectations for the field of study.
styling that reduces time to insight and improves aesthetics.
Key Skills Acquired:
- Adding Explanatory Footnotes and Source Notes
Used
tab_source_note()to append footnotes or cite data sources directly within the table.Provided helpful context for interpretation and ensured reproducibility.
- Adjusting Column Widths with (
cols_width)
Resized specific columns to optimize space usage, especially for wide or dense datasets.
Improved layout and prevented content overflow.
- Formatting Table Values with
fmt_*()Functions
- Applied formatting to numeric values, dates, percentages, and more to enhance clarity and alignment with standards in scientific or business reporting.
- Styling Enhancements Using
data_color(),cols_align()andtab_options()
Applied conditional coloring (
data_color()) to emphasize data ranges or categories.Aligned columns (
cols_align()) for consistency and readability.Customized general table aesthetics using
tab_options()to refine spacing, borders, and fonts.
For a step-by-step guide with practical examples, visit this site.